Authors Marcio Sales, Geostatistics Specialist and Caio Gallego, Operations Intelligence Manager, at Biofílica
Introduction
The high level of strictness required in meeting technical standards, such as additionality and baseline determination, is crucial for the voluntary carbon market. This strictness ensures that certified projects are genuinely contributing to reducing Greenhouse Gas (GHG) emissions and that these reductions are being calculated robustly, feasibly, and conservatively.
Over the past few years, REDD+ (Reducing Emissions from Deforestation and Degradation) projects, particularly those focused on Avoided Unplanned Deforestation (AUD), have been the subject of substantial criticism. The primary concerns revolve around additionality and the quantification of Reduced GHG Emissions, with claims that baseline emissions in most projects are overestimated, artificially inflating the effectiveness of their deforestation reduction actions.
Criticism intensified in January 2023, when the British journal “The Guardian” published an article describing these projects as practically “useless” and, worse, suggesting that they might even increase emissions1. The article had a significant impact, causing distrust and intensifying public and market scrutiny of this category of projects. Consequently, there was a decrease in demand and prices for generated credits, along with a negative impact on supply, reducing the certification of new projects and the flow of credit generation.
In response to these criticisms, Verra, the leading certifying organization for REDD+ projects worldwide, initiated an in-depth review of the VCS (Verified Carbon Standard) program’s methodological framework. The update to its rules and methods for registering REDD+ projects aims to eliminate methodological distortions and increase the transparency and credibility of the projects. Verra’s new methodology, VM0048, directly addresses many of these criticisms, promising greater accuracy and alignment in Reduced Emissions accounting.
In this article, we will explore in detail the harsh criticisms directed at REDD+ AUD projects, examining the validity of the arguments and the relevance of the concerns raised. Additionally, we will analyze the changes proposed by Verra’s new methodology and how they aim to address the issues identified.
Existing Methodologies
Essentially, credits from a REDD+ project are determined by comparing emissions resulting from observed deforestation within the project areas to an estimate of what would be deforested if the project had not been implemented. This hypothetical deforestation estimate, therefore, represents the project’s baseline.
Verra, through its VCS standard, has developed different methodologies for REDD+ application, each establishing guidelines for baseline determination. Although they vary, these methodologies are similar in how they determine baselines. Future deforestation in the absence of a project is estimated using historical data, assuming that future annual deforestation rates will either fluctuate around the historical average or follow a trend (increasing or decreasing) observed over the past 10 years in a reference region that includes the project.
The primary weakness in this process lies in the fact that these methodologies require project developers to construct their own baselines. Criteria are provided to guide this process, which must later be audited by a third party. However, questions have arisen about the variations—and in some cases, overestimations—present in baselines across different projects due to the flexibility offered by the methodologies. According to studies, such methodological weaknesses affect additionality and the quality of reduced emissions quantification in projects.
Weak Additionality
The 2023 Guardian article was based on the findings of two independent scientific studies, one published in the Proceedings of the National Academy of Sciences from a plurinational research group, and the other in Conservation Biology, by researchers from the University of Cambridge, UK. The first study2 analyzed 12 Verra-validated projects in the Brazilian Amazon, comparing their emission reductions calculated using Verra-approved VCS methodologies with an estimate based on an alternative approach called the “Synthetic Control Method”. In this method3, which differs completely from Verra’s methodologies, reductions are estimated by comparing a project’s emissions to an artificial counterfactual metric derived from data in areas with variables similar to those of the analyzed project (Figure 1).
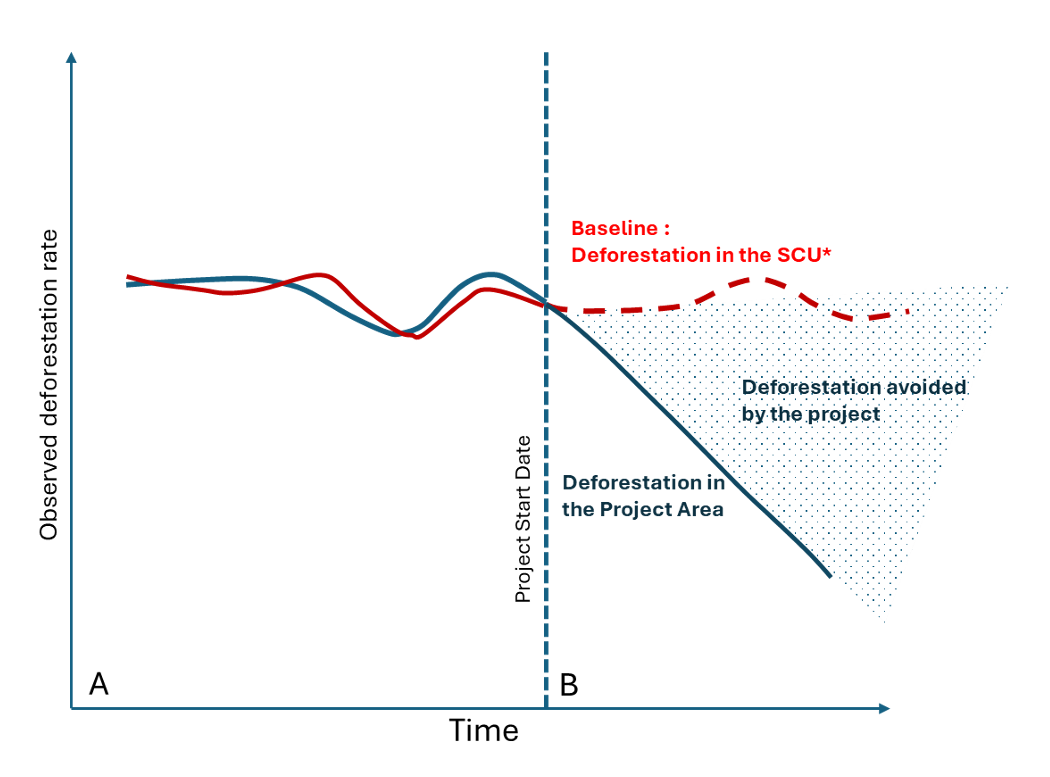 Figure 1: *Figure 1: Emissions reduction estimation scheme using the synthetic control method.
Regions A and B represent the historical period and the post-project initiation period, respectively. SCU: Synthetic Control Unit*
In summary, this method aims to create a sort of replica (Synthetic Control Unit – SCU) of the project area, but without emissions reduction activities, to represent the baseline scenario. The method assumes that the deforestation rates of the constructed synthetic unit represent the project rates after its initiation.
In the cited study, the selected control units exhibited deforestation levels below the baseline values reported by the projects, leading the authors to conclude that almost all projects failed to deliver the claimed emission reductions (Figure 2). At the time, this study received several criticisms, particularly from project developers, concerning flaws in the applied approach. Key criticisms included the selection of areas forming the synthetic unit, the representativeness of the target project universe, among others4 5 6 7 8.
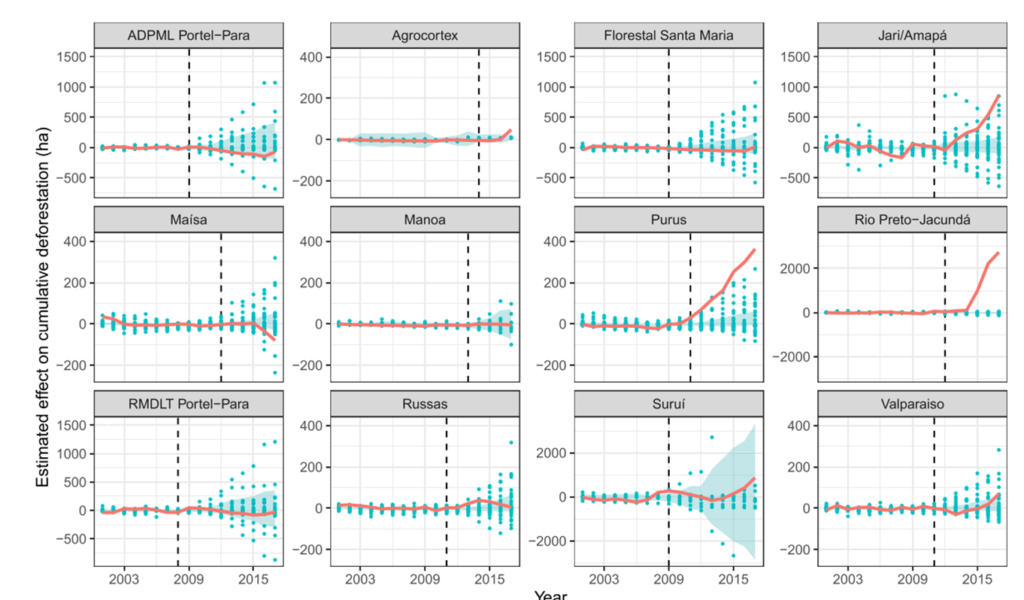
Figure 2: Result from the West et al. study. Blue points indicate estimated emissions reductions/increases
in non-project (placebo/synthetic) areas compared to project observations (red line) using the same method.
The Cambridge study9, on the other hand, used a more representative selection of Verra-registered projects but also found a lower reduction in emissions compared to reported values. However, the study showed that the projects exhibited positive additionality, unlike the first study. The authors used the “matching” or “statistical matching” method, another approach for evaluating the impact of interventions, similar to the synthetic control method.
The difference between the two methods is that, while the latter evaluates each project individually, matching can be applied to a group of projects, allowing a broader assessment of intervention effects. The method selects one or more control areas with similar characteristics for each project in the intervention group, forming two “matched” groups. The impact of the projects on CO2 emissions is calculated as the difference between the average emissions in the two groups for each period following the start of each project. This second study indicated that the analyzed projects had additionality of approximately 47%, partially diverging from the first study, but still below reported values. Similar to SCU, matching shares the same assumption that control group areas continue to represent the project characteristics post-initiation.
Finally, it is worth noting that, unlike VCS methodologies, emission reductions calculated by SCU or matching methods are only calculated ex-post. This means that these procedures do not, at least directly, allow for ex-ante predictions of project emissions reductions and, consequently, its potential credit generation. Verra’s methodologies, on the other hand, project future deforestation based on recent historical patterns, allowing for feasibility analyses prior to project implementation, which is crucial for any endeavor requiring planning and upfront investment. Despite the differences and limitations of the two studies, both pointed to potential distortions that needed to be further analyzed and resolved if confirmed.
Finding the root of the problem
Regarding Verra’s VCS REDD+ methodologies, a fundamental aspect for this discussion is worth highlighting. It is known among project developers that, before consolidation, different methodologies could be applied to the same project. Thus, baseline estimates showed high sensitivity depending on the chosen methodology and the parameters and procedures each methodology allowed.
In 2024, a study titled “Methodological Issues with Deforestation Baselines Compromise the Integrity of Carbon Offsets from REDD+”10, with participation of some researchers of the plurinational group, went straight to the root cause of these distortions and illustrated the issues more assertively. While this recent study’s representativeness is insufficient to generalize the results, it is enough to demonstrate that the flexibility allowed in methodology choice and its parameters produces significant variation in estimated emission reductions. Since the choice of methodology and application of parameters has always been at the project developer’s discretion, this flexibility could (intentionally or not) facilitate the generation of baseline overestimations. As baseline distortions resulting from the variety and flexibility of rules did not necessarily violate methodological standards, auditing and certification standards could not disapprove. This methodological inconsistency has long-enabled distortions, such as similar projects within the same region having vastly different baselines.
Verra’s New REDD+ Methodology
As discussed, The Guardian article and the studies mentioned in the previous section significantly impacted the carbon credit market, raising serious concerns about the integrity of generated credits. In response, Verra began a detailed review of its methodological framework in 2023. All previous methodologies are being replaced by a new integrated methodology, VM0048, which will apply to all REDD+ approaches.
This new methodology is expected to ensure greater integrity of credits generated by REDD+ projects and restore market confidence. Adopting a more robust and transparent approach aims to ensure that carbon credits more accurately reflect the climate benefits generated, promoting greater credibility and confidence among stakeholders.
The new methodology does not adhere to the methods proposed by the critics’ studies, which have weaknesses as previously discussed. Notwithstanding, it introduces significant advancements as outlined below (Figure 3):
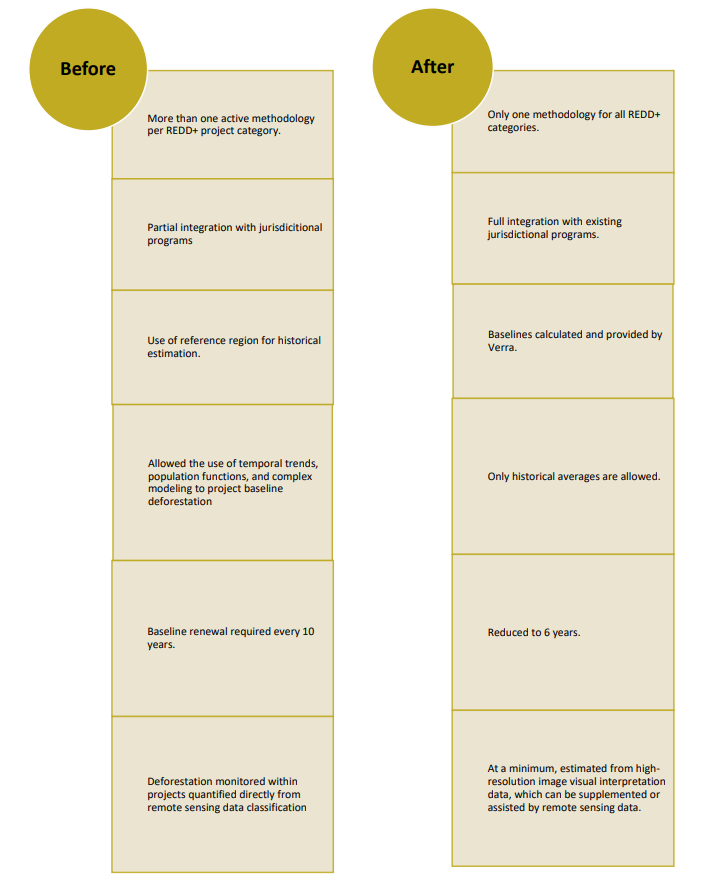
Figura 3: Principais mudanças com a metodologia VM0048
These changes largely address previously highlighted issues. Primarily, they eliminate the flexibility allowed by previous methodologies, as activity data will be generated in advance and allocated to projects directly by Verra, as a new service provided by the Standard. Thus, estimates will be calculated using a universal method, ensuring consistency in emission reduction accounting and carbon credit generation at the jurisdictional level, regardless of the quantities allocated to projects.
Another improvement is the use of historical deforestation rate estimates based on statistical methods. Previous methodologies allowed direct use of land cover classification data to calculate deforested area during the historical period, a procedure known to generate biased estimates11. Fortunately, this error can be reduced using original probabilities12 or probabilistic sampling estimates13, which is the solution employed in the new methodology.
The new method also aims to increase the conservatism of future emission projections, limiting them to historical deforestation averages over the last 10 years in each jurisdiction (Figure 4). Some previous methodologies allowed projections based on observed trends of increasing or decreasing deforestation rates. However, this could overestimate future deforestation if, for example, a previously observed upward trend did not continue in the future. This measure is reinforced by reducing the baseline validity period from 10 to 6 years, requiring more frequent adjustments to activity data. This helps to avoid overestimations (or underestimations) at the jurisdictional level due to shifts in deforestation patterns between validation periods.
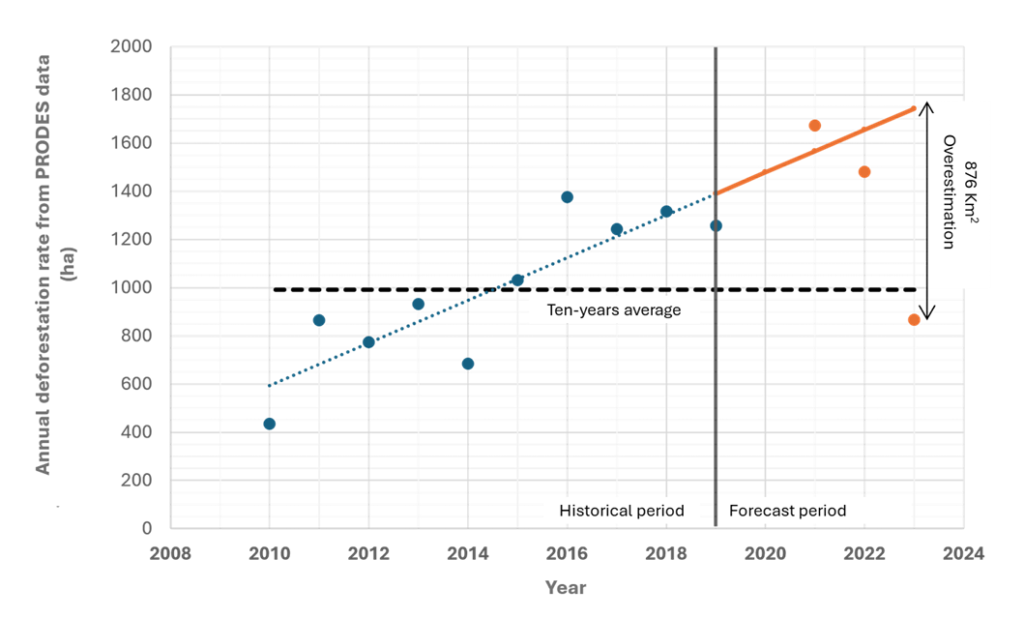
Figure 4: Example illustrating a case where a linear model fitted on historical data would overestimate future deforestation
due to a break in the past trend. Data (points) correspond to annual deforestation rate estimates from PRODES for the State of Acre. Historical (blue) and forecast (orange)
periods were arbitrarily selected to illustrate the example.
Another remarking change with the new methodology is that historical deforestation averages for entire jurisdictions are allocated based on a spatial model of deforestation risk, so projects “get” a fraction of their jurisdictions’ activity data based not only in their size but also location in relation to deforestation hotspots. Currently, the allocation model uses only one variable, distance to forest edges, but has acceptable accuracy as this is one of the factors most correlated with the risk of deforestation14. Over time, this basic model should be enhanced or replaced with more complex and accurate ones but, most importantly, the initial model reduces the chance of overestimating the baselines for the jurisdiction as a whole.
Remaining Challenges
As shown above, the proposed changes in the new methodology are expected to significantly reduce baseline distortions across projects, enabling better evaluation of their additionality and aligning accounting at the jurisdictional level. However, despite ensuring consistency at the jurisdictional scale, the current simplified allocation model may lead to biases at the local scale, sometimes underestimating the additionality of high-deforestation-risk projects or, in other cases, overestimating those in low-risk areas. Moreover, as REDD+ AUD projects are viable only in regions with higher deforestation pressure, this effect may prevent project implementation in certain regions, reducing the conservation potential of the mechanism.
This issue will be mitigated as more sophisticated models are adopted by the methodology. Additionally, the methodology modules addressing unplanned degradation occurrence and Avoided Planned Deforestation (APD) still require further definition.
Future Perspectives
Despite remaining challenges and necessary adjustments to the new methodology, it represents a significant step forward in addressing the issues. REDD+ projects are certainly useful for reducing GHG emissions, and the enhancement of new methodologies should reinforce their effectiveness with more accurate measures of their additionality. This is expected to restore confidence in these projects and revitalize the market.
It is worth noting that credits from Nature-Based Solutions (NBS) projects remain the most sought-after in the market, with the highest transaction volumes and retirement rates in 2022 and 202315. Additionally, REDD+ AUD projects account for approximately 50% of registered REDD+ projects and represent the majority of generated credits.
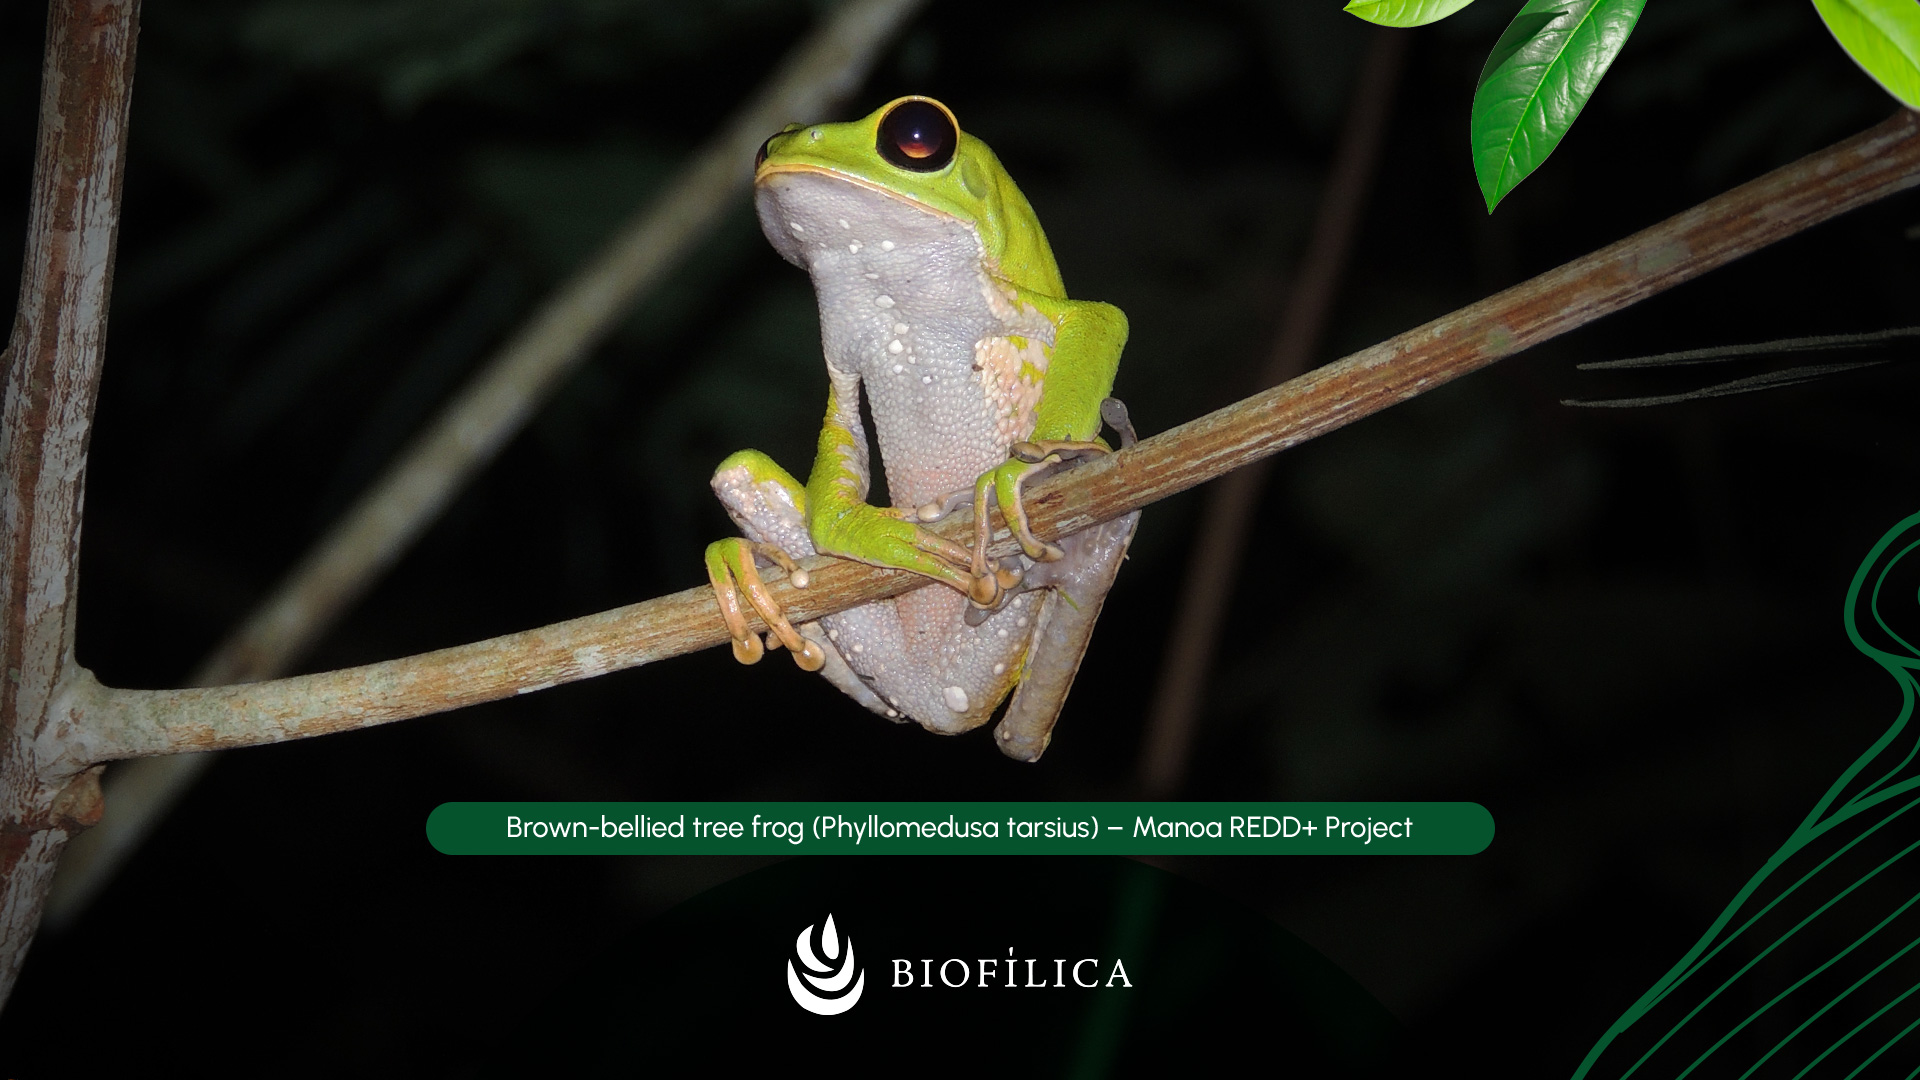
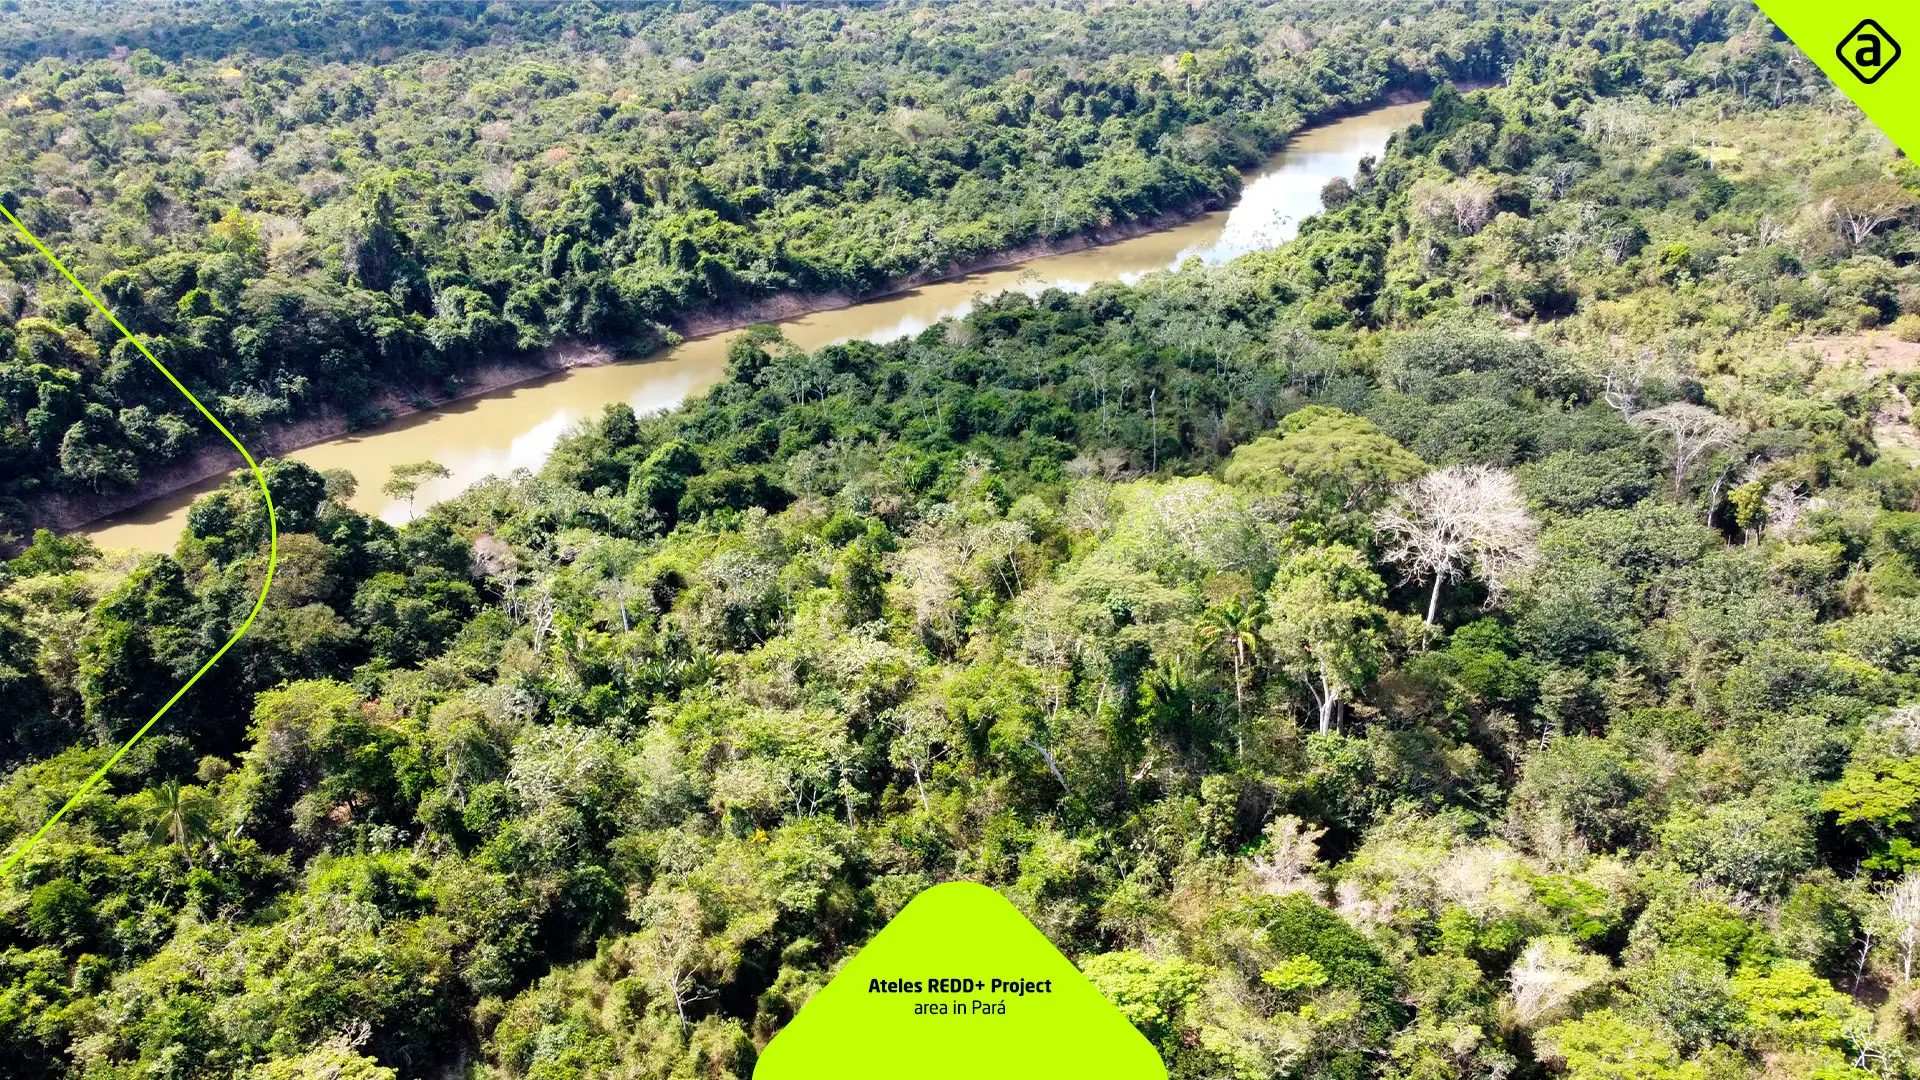
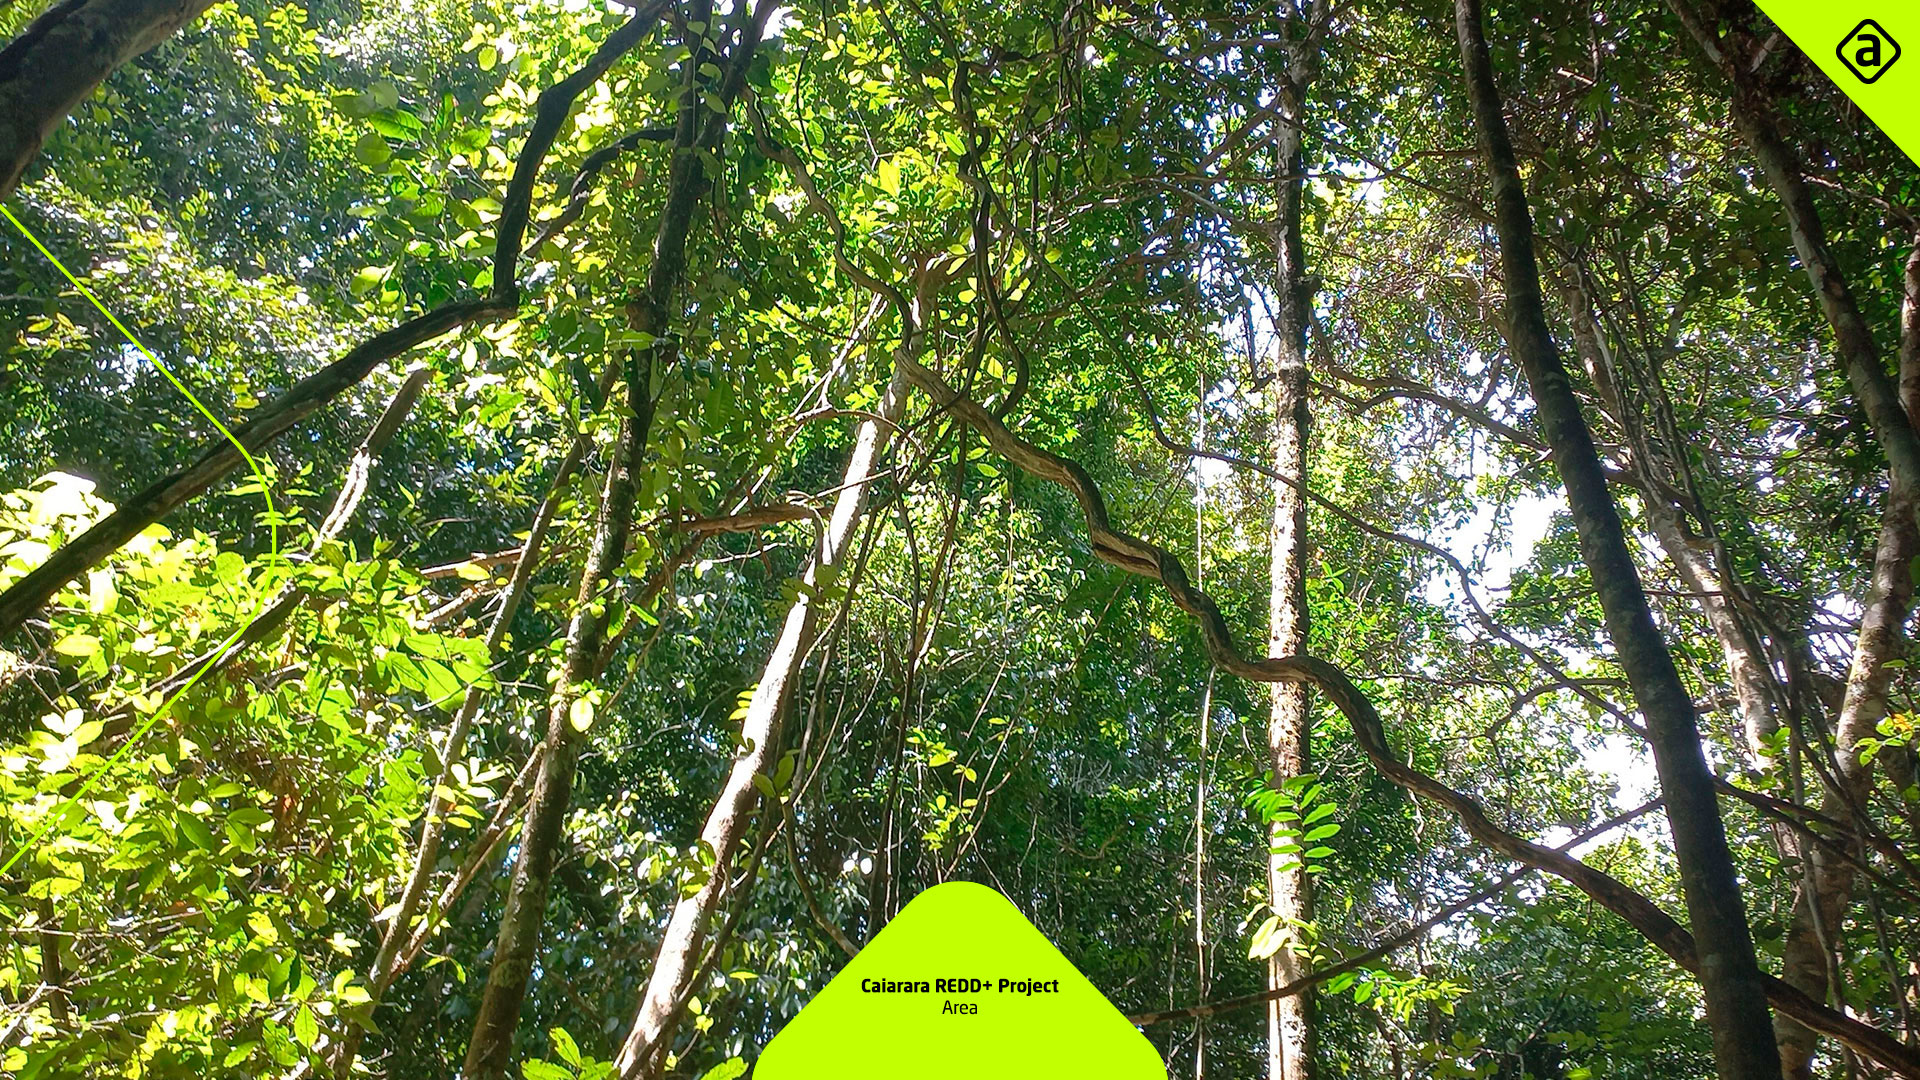
The preference for projects in this category can be explained by benefits beyond emissions reductions, such as biodiversity conservation and the socioeconomic development of local communities. The REDD+ projects developed by Biofílica contribute to the conservation of 2.5 million hectares of forests, home to dozens of endangered species of fauna and flora, impacting over 130 local communities.
There is a strong outlook for the restoration of the REDD+ market, given its crucial importance for climate change mitigation and biodiversity preservation. These projects, when well-executed, not only contribute to GHG emission reductions but also promote sustainable development in local communities and ecosystem conservation. With the continuous evolution of accounting methodologies and growing global recognition of the urgent need for effective climate actions, the forest conservation-derived carbon market is expected to continue expanding, attracting investments, and contributing to the achievement of global climate goals.
Do you have any questions or want to discuss the topic further?
Our team of technical and institutional experts is available to provide additional support and clarifications.

[1] Jornal “The Guardian”. “Revealed: more than 90% of rainforest carbon offsets by biggest certifier are worthless, analysis shows.”. Available at: https://www.theguardian.com/environment/2023/jan/18/revealed-forest-carbon-offsets-biggest-provider-worthless-verra-aoe
[2] West, Thales A. P., Jan Börner, Erin O. Sills, e Andreas Kontoleon. 2020. “Overstated Carbon Emission Reductions from Voluntary REDD+ Projects in the Brazilian Amazon”. Proceedings of the National Academy of Sciences 117 (39): 24188–94. https://doi.org/10.1073/pnas.2004334117.
[3] Abadie, Alberto. 2021. “Using Synthetic Controls: Feasibility, Data Requirements, and Methodological Aspects”. Journal of Economic Literature 59 (2): 391–425.
[4] Malan, M., Carmenta, R., Gsottbauer, E., Hofman, P., Kontoleon, A., Swinfield, T., & Voors, M. (2024). Evaluating the impacts of a large-scale voluntary REDD+ project in Sierra Leone. Nature Sustainability, 7(2), 120-129.
[5] Study analysis of “West et al. (2020): Overstated carbon emission reductions from voluntary REDD+ projects in the Brazilian Amazon” available at: https://www.climatepartner.com/en/knowledge/insights/study-analysis-of-west-et-al-2020.
[6] Our analysis of The Guardian’s criticism of Verra. Systemicka Team. Available at: https://systemica.digital/en/nossa-analise-sobre-critica-do-the-guardian-a-verra/
[7] Technical Review of West et al. 2020 and 2023, Guizar-Coutiño 2022, and Coverage in Britain’s Guardian. Verra. Available at: https://verra.org/technical-review-of-west-et-al-2020-and-2023-guizar-coutino-2022-and-coverage-in-britains-guardian/
[8] Carbonext-Response to West at al’s (2020) Study. Available at: https://www.documentcloud.org/documents/20475770-response-to-west-et-al-from-carbonext_8-technical-audience
[9] Guizar-Coutiño, Alejandro, Julia P. G. Jones, Andrew Balmford, Rachel Carmenta, e David A. Coomes. 2022. “A Global Evaluation of the Effectiveness of Voluntary REDD+ Projects at Reducing Deforestation and Degradation in the Moist Tropics”. Conservation Biology 36 (6): e13970.
[10] Stuart, Elizabeth A. 2010. “Matching methods for causal inference: A review and a look forward”. Statistical science : a review journal of the Institute of Mathematical Statistics 25 (1): 1–21. https://doi.org/10.1214/09-STS313.
[11] West, Thales A.P., Barbara Bomfim, e Barbara K. Haya. 2024. “Methodological Issues with Deforestation Baselines Compromise the Integrity of Carbon Offsets from REDD+”. Global Environmental Change 87 (julho):102863. Disponível em https://www.sciencedirect.com/science/article/pii/S0959378024000670
[12] Sales, Marcio H. R., Sytze de Bruin, Carlos Souza, e Martin Herold. 2021. “Land Use and Land Cover Area Estimates From Class Membership Probability of a Random Forest Classification”. IEEE Transactions on Geoscience and Remote Sensing, 1–11. https://doi.org/10.1109/TGRS.2021.3080083.
[13] Sales, Marcio H. R., Sytze de Bruin, Carlos Souza, e Martin Herold. 2021. “Land Use and Land Cover Area Estimates From Class Membership Probability of a Random Forest Classification”. IEEE Transactions on Geoscience and Remote Sensing, 1–11.
[14] Olofsson, Pontus, Giles M. Foody, Martin Herold, Stephen V. Stehman, Curtis E. Woodcock, e Michael A. Wulder. 2014. “Good Practices for Estimating Area and Assessing Accuracy of Land Change”. Remote Sensing of Environment 148 (maio):42–57.
[15] Jaffé, Rodolfo, Samia Nunes, Jorge Filipe Dos Santos, Markus Gastauer, Tereza C. Giannini, Wilson Nascimento Jr, Marcio Sales, Carlos M. Souza, Pedro W. Souza-Filho, e Robert J. Fletcher. 2021. “Forecasting Deforestation in the Brazilian Amazon to Prioritize Conservation Efforts”. Environmental Research Letters 16 (8): 084034. https://doi.org/10.1088/1748-9326/ac146a.
[16] Forest Trends’ Ecosystem Marketplace. 2024. “State of the Voluntary Carbon Market 2024”. Washington DC: Forest Trends Association.